


The AI era has put developer productivity under a spotlight.
Engineering leaders everywhere are asking the same deceptively simple question: Are developers becoming more productive with AI? On paper, the answer can look obvious. Studies show AI coding assistants can reduce the time required for certain coding tasks by up to 56%. A recent study found that engineers using GitHub Copilot completed about 40% more code changes in the weeks they used it heavily compared to weeks they didn’t use it at all. More code is being produced than ever, and AI usage is rising quickly.
But there’s a problem: Productivity is not a simple measure of developer activity—it is a measure of our ability to deliver outcomes.
To understand productivity, we need to look at the holistic developer experience, and we need to understand how developers spend their time. At Microsoft, we’ve transformed how we understand and improve developer productivity through Engineering Thrive (EngThrive). The core idea is simple: Make it fast and easy to build great products.
EngThrive helps us understand productivity by creating a set of core metrics focused on Speed, Ease, Quality, and Thriving. Together, these dimensions give us a language for evaluating not just developer tools and AI, but the broader systems that shape engineering work: infrastructure, organizational design, workplace policy, and culture.
This focus matters now more than ever, because AI is changing the meaning of engineering activity. Code volume, PR counts, and task completion are changing wildly. But the outcomes we care about remain largely the same: speed of delivery, sustainable engineering systems, quality, and customer value.
Software engineering is more than coding
Everyone knows that AI can make coding dramatically faster. Yet developers across the industry only spend roughly 15% of their day writing new code. Even after including testing and debugging, most studies put hands-on coding work at only 25–30% of a developer’s total time.
The vast majority of developer time is spent on tasks both inside and outside the SDLC—ranging from “keep the lights on” tasks (operational work, software updates and maintenance), organizational responsibilities (meetings, compliance, administrative tasks), technical planning (design docs and reviews), and much more.
At Microsoft, we’ve run studies internally and cross-industry to understand where developers spend their time. The below diagram is based on a recent analysis of developer workflows, and it highlights the full breadth of work it takes to plan, create, and operate software at scale.
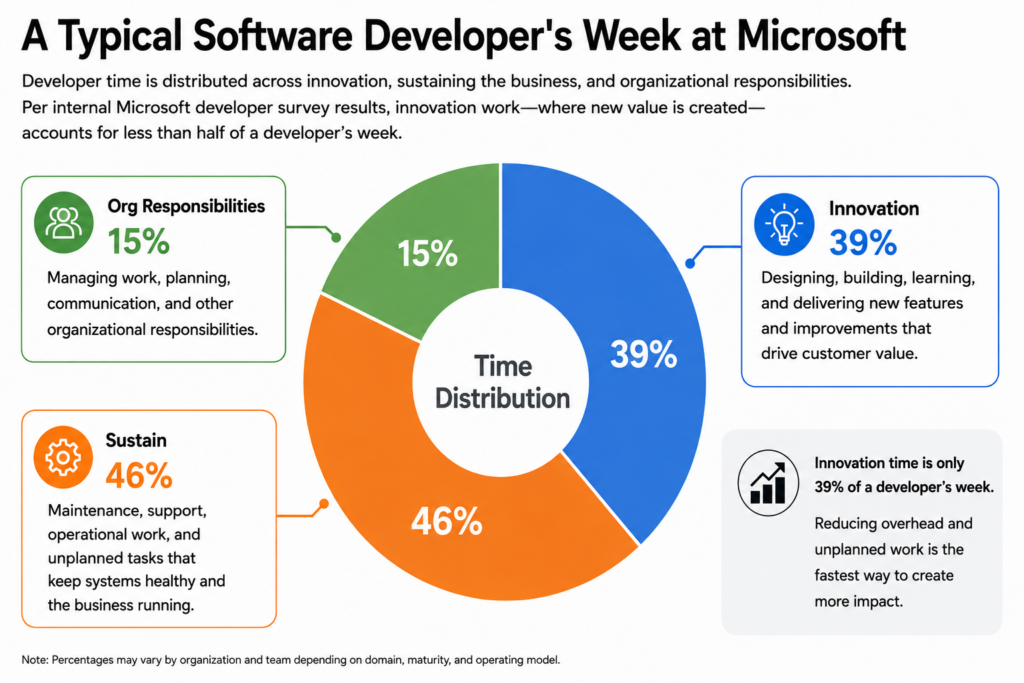
While the exact distribution varies by organization, the pattern is surprisingly consistent across the industry: Coding is only a fraction of an engineer’s workload, and a wide variety of tasks consume the vast majority of developer time and energy.
This diagram reminds us that improving productivity first requires us to understand where we spend time and energy. We then use that understanding to target and improve the factors that create toil, repetition, or classes of work that can be accomplished via automation/AI.
The EngThrive model
EngThrive approaches productivity as a system composed of three interacting dimensions (Speed, Ease, Quality) with a fourth layer (Thriving) acting as a guardrail.
Rather than measuring isolated engineering activities, EngThrive measures the health of the engineering system and how it impacts developer journeys:
- How quickly do ideas become customer value?
- How much toil and friction do developers experience?
- Does quality remain sustainable?
- Can teams operate effectively without burning out?
This becomes especially important in AI-assisted engineering environments. As AI tools mature, the meaning of traditional engineering artifacts starts to change, but the underlying organizational questions remain remarkably stable:
- How long does it take to turn ideas into impact?
- Where do organizational toil and friction slow teams down?
- Can developers consistently do high-quality work without the system fighting against them?
- Are we shipping sustainably?
These are the questions EngThrive helps us understand, identify, and then improve.
Activity metrics are not outcome metrics.
The COVID productivity paradox
The danger of equating activity with productivity becomes clearest in moments when the metrics tell conflicting stories.
During the first months of mandatory remote work in response to COVID-19 in 2020, three things happened at Microsoft simultaneously: Pull requests per developer increased by more than 20%, the company’s stock price rose over 15%, and 78% of developers reported feeling burned out during the same period. The first two metrics painted a glowing picture. The third revealed a more troubling reality.
Productivity signals routinely diverge, and the signals you pay attention to matter. In the above example, if you focused on activity metrics, engineering looked extraordinarily productive. If you looked at business metrics, everything was on track. If you looked at human outcomes, the system was failing.
This reveals a fundamental measurement problem: Organizations often track activities (lines of code, pull requests, tasks) and treat them as proxies for outcomes (value delivered, speed, quality). But they are not the same. Conflating the two produces systems that are precise but wrong, leading to metric gaming and unintended behaviors that move organizations away from desired outcomes.
That’s the core insight at the heart of EngThrive: We focus on a triad of outcome metrics—Speed, Ease, and Quality—and only use activity metrics to help us understand changing patterns.
Productivity measures systems, not individuals
EngThrive deliberately avoids treating productivity as a way of measuring individuals. With metrics focused on Speed+Ease+Quality, it makes no sense to ask, “Did this individual developer have faster build times?” Instead, we understand that project build times are an essential component of “Speed,” and we look for places where those metrics are struggling.
That distinction matters because most productivity problems are system problems—and even the highest performing individual, in the context of a slow/toilsome system, will only reach a tiny fraction of their capability.
That is also why AI adoption outcomes vary so dramatically across organizations. The teams seeing the biggest gains from AI are the ones using AI to specifically target the drivers that impact Speed, Ease, and Quality. They’re the teams using AI to lower operational friction, improve onboarding, accelerate feedback loops, and enable engineers to spend more time and energy on innovation.
The takeaway
EngThrive is a concrete model for organizations that want to move beyond simply measuring activity toward improving outcomes.
The engineering teams that win in the AI era probably won’t be the ones generating the most code. They’ll be the ones best at reducing organizational friction around humans working with increasingly capable AI systems. And that’s a fundamentally different optimization problem than most companies are currently tracking.
Read the paper to learn more about EngThrive, its outcome-oriented North Star metrics, its diagnostic submetrics, and how it combines developer surveys and system telemetry to arrive at insights with both scale and context.