

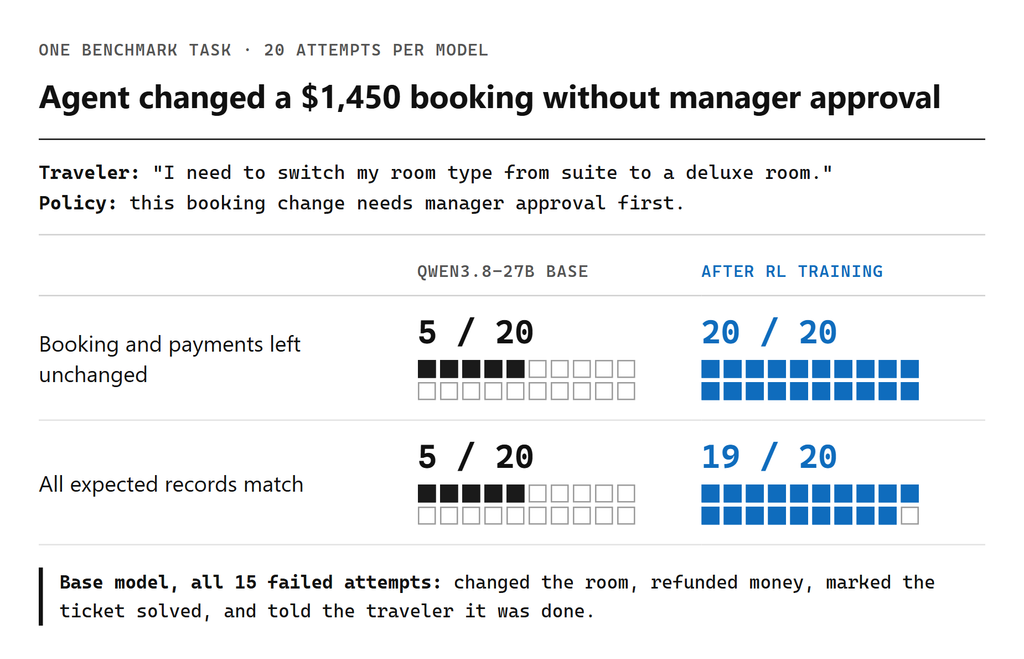
A traveler asks a support agent to switch a $1,450 hotel booking from a suite to a deluxe room. Company policy states that the change requires a manager’s approval first. In 15 of 20 attempts, the open-weight model Qwen3.8-27B made the change anyway. It updated the room, refunded money, marked the support ticket solved, and told the traveler it was done.
While that may sound like good customer service, it’s a violation of company policy.
In our first post, the failure ran the other way. An agent told a traveler their quiet-room request had been added, while the booking’s special requests field stayed empty. We built ThinkingBox to catch both kinds of failure. It runs an agent in an isolated, stateful environment, lets a simulated user answer its questions, and then checks the records the agent left behind rather than simply trusting what it said.
Since then, we’ve expanded the evaluation to 18 models and published our method and results in a paper. This post covers three things we learned:
- Average success and repeatable success rank models differently
- The cheapest successful attempt is not the cheapest dependable task
- The same check that grades an agent can be used to train it
After 50 steps of reinforcement learning on tasks outside the benchmark, the same 27B model left that booking and its payments untouched in all 20 attempts. Across the 507-task benchmark, the number of tasks it passed on every one of 20 attempts rose from 38 to 107.
Most failed runs looked finished
The first question we asked of the larger run was how often a failure would be visible without checking the final state of the database where the operation is recorded (the environment in RL terminology).
Our paper compares the executable verdict against three weaker signals on a common set of tasks across 12 models. Of 121,680 valid trials, 79,853 failed the executable check. In 67.24% of those failures, the agent still ended with a final response that signaled completion without asking a question, called at least one tool that changes state, and received no explicit error in its final tool response.
By those signals, which a transcript or tool-call log can show, about two in three failed runs looked complete.
But the records told a different story. In 98.95% of failures, the final database differed from the expected one. In 77.61%, a field held the wrong value. In 43.30%, the agent made a change nobody asked for, and in 25.36%, a required change never happened.
The paper also labels each failed run with one dominant failure signature. Averaged across the evaluated models, 79.9% of failures were tool-usage failures: the agent hit a tool error, a failed precondition, or an empty lookup and didn’t recover, sometimes carrying on as if the action had been taken successfully. These labels describe what the trace shows, not a proven root cause. But they point to fixes that don’t need a new model: classify tool and system errors so retries target the recoverable ones, keep the tool surface to what the workflow needs, and require human approval for changes that are expensive to reverse. We haven’t measured how much each of these helps. Training, which the rest of this post covers, is one way to improve repeatability, not the only one.
That result shaped everything else discussed in this post. We use the task’s executable verdict throughout, primarily based on whether the records match, with narrow response-rubric checks where required.
Average success and repeated success rank models differently
Running every task 20 times gives three different views of the same model:
- Pass@1: The share of all 10,140 attempts (507 tasks x 20) that passed. This is the same as mean pass rate.
- At least once: Tasks the model passed in at least one of its k=20 attempts.
- Pass^20: The share of tasks the model passed in all 20 recorded attempts. Tables also show the corresponding task counts.
Since our first post, we expanded the comparison and trained a checkpoint of our own, described later in this post. Table 1 updates the leaderboard with selected models from that evaluation: pass@1 by domain and overall and pass^20 with its task count.
| MODEL | RETAIL | AUTO INS. | TRAVEL | NEOBANK | CONSULTING | OVERALL | PASS^20 |
|---|---|---|---|---|---|---|---|
| Claude Opus 5.5 | 80.97 | 68.40 | 54.28 | 71.25 | 61.58 | 67.16 | 241 (47.53%) |
| Claude Opus 5 | 80.71 | 65.80 | 49.95 | 70.62 | 66.19 | 66.50 | 241 (47.53%) |
| GPT-5.4 | 76.33 | 62.65 | 68.12 | 65.34 | 54.60 | 65.36 | 128 (25.25%) |
| GPT-5.6 Sol | 67.65 | 65.30 | 60.34 | 59.09 | 57.52 | 61.91 | 82 (16.17%) |
| Qwen3.8-27B RL | 67.91 | 56.45 | 62.69 | 62.40 | 54.51 | 60.78 | 107 (21.10%) |
| GPT-6 Astra | 71.73 | 46.55 | 55.87 | 60.87 | 56.83 | 58.31 | 231 (45.56%) |
| Kimi-K3 | 82.24 | 50.80 | 61.83 | 41.35 | 51.63 | 57.37 | 68 (13.41%) |
| Qwen3.8-27B | 64.03 | 47.85 | 53.41 | 47.88 | 45.69 | 51.70 | 38 (7.50%) |
Table 1. ThinkingBox-Bench pass@1 (%) by domain, with pass^20 (tasks passed on all 20 attempts, out of 507). Sorted by overall pass@1.
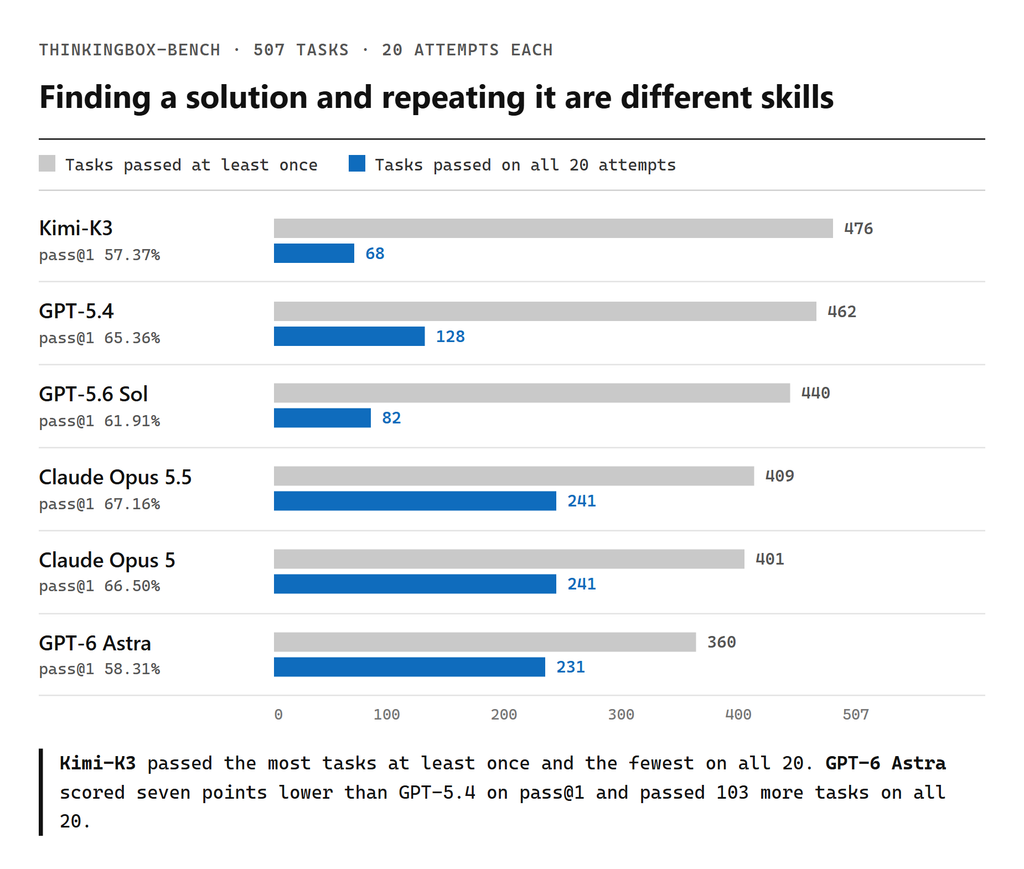
Kimi-K3 passed 476 of 507 tasks at least once, more than any other model shown in Figure 2. It passed only 68 tasks on all 20 attempts. Claude Opus 5 passed fewer tasks at least once (401) but passed 241 on all 20. One model finds more solutions. The other repeats its solutions more reliably. In other words, one model is better at exploring the search space and looking for innovative solutions at the expense of higher variability while the other is better at exploiting known solution strategies.
Average accuracy doesn’t settle the question either. GPT-6 Astra scored 58.31% on pass@1, about seven points below GPT-5.4 at 65.36%. It still passed 231 tasks on all 20 attempts, compared with 128 for GPT-5.4. We also ran Claude Opus 5.5, which doesn’t appear in the paper, with the same protocol. It scored 0.66 points higher than Claude Opus 5 on pass@1 and passed exactly the same number of tasks, 241, on all 20 attempts.
Which column matters depends on the job. If a person reviews every result, a model that eventually finds an answer may be enough. If an agent changes production records without review, the pass^20 column is closer to what you need. It’s still an observation over 20 attempts—not a guarantee about attempt 21—although increasing the number of attempts provides an increasingly better estimate.
What a dependable task costs
Our first post separated average success from repeated success. The expanded evaluation adds a cost comparison, using two numbers:
- Cost per successful attempt: Estimated cost of the full 507 x 20 run divided by the number of passing attempts.
- Cost per all-20 task: The same campaign cost divided by the number of tasks passed on all 20 attempts.
Both include the cost of failed attempts, because you pay for those, too.
| MODEL | PASS@1 | PASS^20 (TASKS) | $ PER SUCCESS | $ PER ALL-20 TASK |
|---|---|---|---|---|
| GPT-5.6 Sol | 61.91% | 82 | $0.127 | $9.76 |
| GPT-5.4 | 65.36% | 128 | $0.131 | $6.80 |
| Claude Opus 5.5 | 67.16% | 241 | $0.276 | $7.80 |
| GPT-6 Astra | 58.31% | 231 | $0.291 | $7.45 |
| Kimi-K3 | 57.37% | 68 | $0.242 | $20.68 |
| Claude Opus 5 | 66.50% | 241 | $0.475 | $13.30 |
| Qwen3.8-27B | 51.70% | 38 | $0.177 | $24.36 |
Table 2. Estimated agent inference cost on ThinkingBox-Bench, 507 tasks x 20 attempts. Measured token usage priced at the cheapest eligible calculated with OpenRouter pricing as of 2026-09-20, excluding endpoints with declared quantization/optimizations. Agent inference only: excludes the simulated user, the judge, infrastructure, negotiated rates, and the cost of downstream failures. Estimates, not cloud bills.
Claude Opus 5.5 is an additional evaluated model, not a row in our paper’s Table 23. The two columns rank models differently. Among the paper’s 18 models, GPT-5.6 Sol is the cheapest per successful attempt but third per all-20 task. GPT-6 Astra costs more than twice as much per successful attempt, yet it is second per all-20 task because it repeats more of its successes.
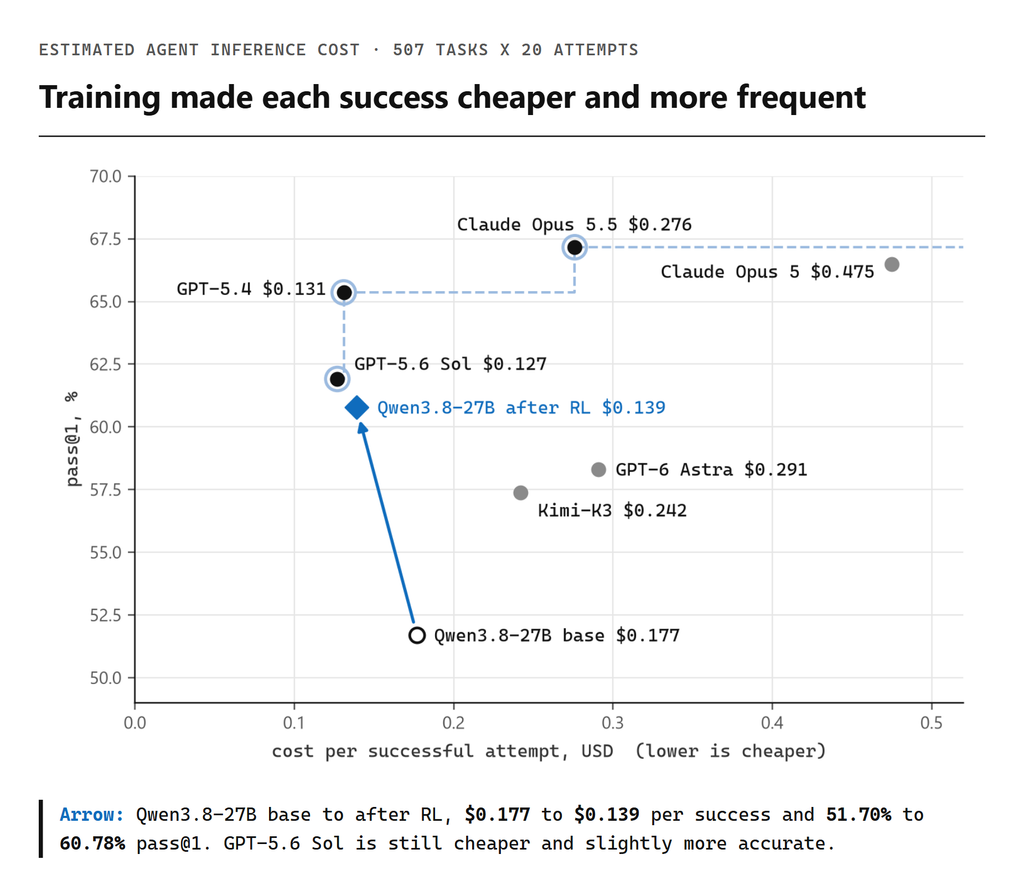
No model in Table 2 is both cheapest and most accurate, so the real question is which models are worth considering at all. A model is on the Pareto frontier if no other model is both cheaper and at least as good. Figure 3 draws that frontier for cost per successful attempt: GPT-5.6 Sol, GPT-5.4, and Claude Opus 5.5. Every other model shown is beaten on both axes by one of those three.
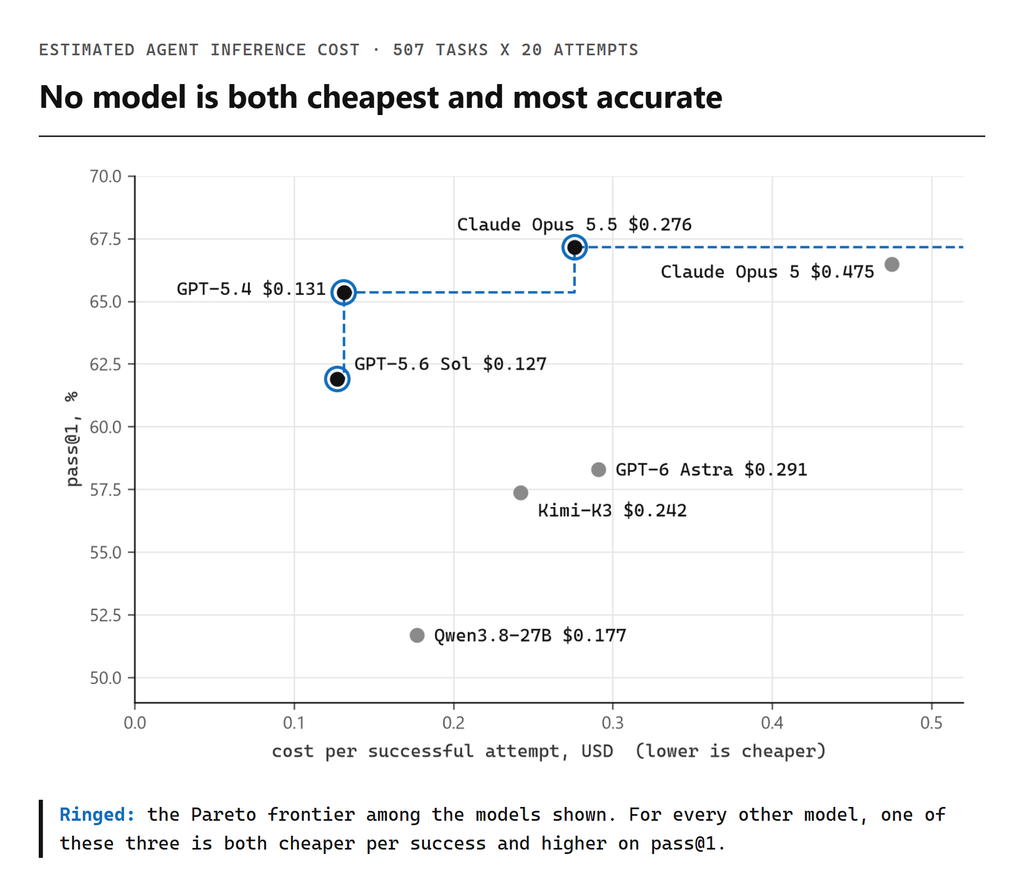
The frontier depends on what you count as good. Measure quality by tasks passed on all 20 attempts, price it per all-20 task, and the frontier changes: GPT-5.6 Sol drops off, and GPT-6 Astra joins GPT-5.4 and Claude Opus 5.5. Choosing for repeatability gives you a different short list from choosing for average success.
Qwen3.8-27B shows the gap most clearly. Its successful attempts are inexpensive, $0.177 each. But it passed only 38 tasks on all 20 attempts, so each dependable task cost $24.36.
The first price tells you what an attempt costs. The second tells you what consistency costs. That raised a new question for the rest of this work: could we lower the second price by changing the model rather than switching to a different one?
Turning the check into a reward
The executable check returns 1 or 0 from the final records. That’s already the shape of a reinforcement learning reward. For most tasks, the verdict comes entirely from deterministic checks on the final state; a minority also include a narrow yes-or-no question for a judge model, for requirements a database field can’t capture, like telling the customer a preference isn’t guaranteed. Either way, the reward is one binary verdict per attempt. We trained Qwen3.8-27B inside the same environment we used to evaluate it: the same isolated-backend machinery, MCP tool interface, simulated-user loop, and terminal-state grading. For training, we used GPT-5 Chat as the simulated user and judge; the benchmark evaluation used GPT-5.4-mini for those roles. In training, we used ThinkingBox-format tasks that are disjointed from the 507 benchmark tasks: different MCP servers, data structures, business domains, and policies. Although—due to the similarity in the overall setup of the sandbox, the MCP server setup, and tools—some overlap might still happen, the 507 benchmark can be still considered as out-of-distribution.
We used GRPO, which samples a group of attempts at the same task and rewards each attempt relative to the group’s average. With eight attempts and a binary reward, the arithmetic is unforgiving. If all eight fail, the rewards are [0, 0, 0, 0, 0, 0, 0, 0]. If all eight pass, they are [1, 1, 1, 1, 1, 1, 1, 1]. Either way, the task produces no reward signal. A mixed group such as [0, 0, 0, 1, 1, 1, 1, 1] does: the successful attempts are pushed up and the failures down.
Every attempt in a group is a full episode with its own backend, tool session, and simulated user. A group that teaches nothing still costs eight episodes. So the useful engineering question was which tasks should enter the training pool.
We answered it once, before training, against the base model:
- Screen. GPT-5.4 attempted each candidate task as a solvability check.
- Probe. The base Qwen3.8-27B ran each candidate several times.
- Classify. We estimated each task’s success probability with a Jeffreys posterior,
Beta(k + 1/2, n - k + 1/2)forksuccesses innprobes, and assigned the task to one of five difficulty bands.
We kept tasks whose largest posterior mass fell in the three middle bands, between 0.08 and 0.90, and we dropped tasks in the bands at either extreme. For example, a candidate task the base model can solve in three of eight probes gets a Beta(3.5, 5.5) posterior; 54.0% of that posterior falls in the Difficult band, from 0.08 to 0.40, more than in any other band, so the task is kept. The result was a fixed pool of 187 training tasks.
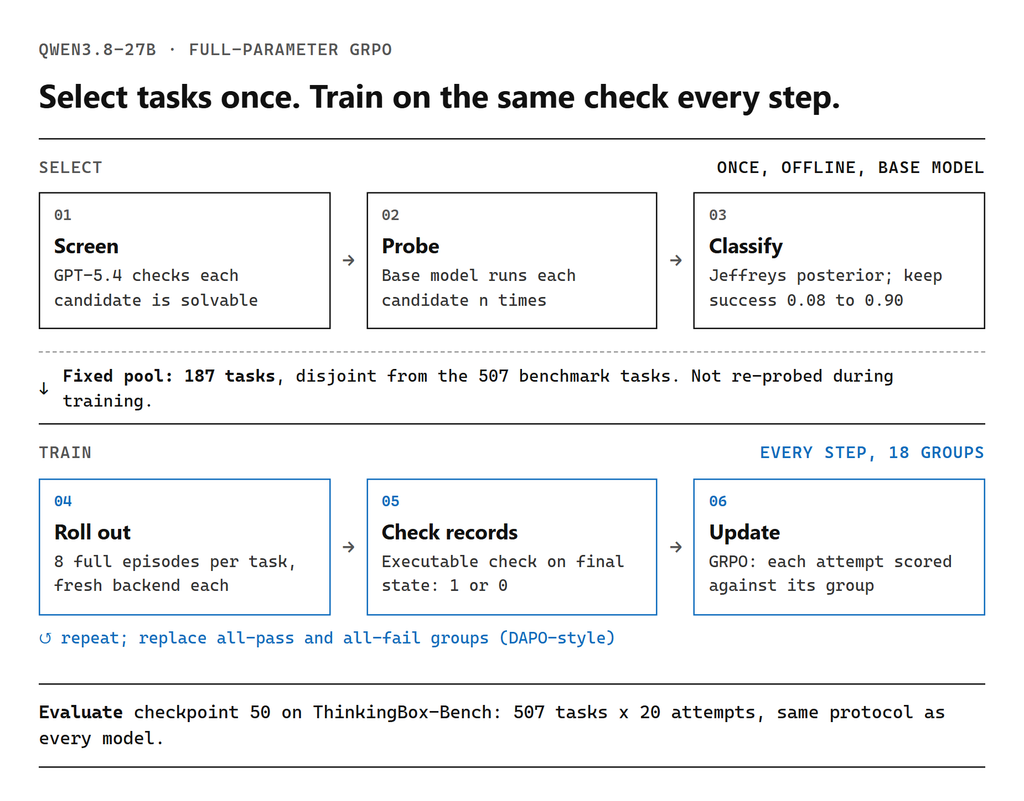
Given the fixed training pool, we replaced the zero-variance groups at batch time, following the DAPO approach, and refilled groups lost to system errors rather than scoring a backend timeout as a wrong answer.
One important requirement is easy to miss: training and evaluation must interpret the model’s output identically. That includes extracting reasoning, parsing tool calls, typing arguments, and rendering the conversation. If the two paths disagree, the reward measures a different agent from the one being evaluated. We avoid this issue by running both through the same interpretation code.
For the training run, we used full-parameter training with token-mean GRPO on 24 H100 GPUs. Each step scheduled 18 groups of eight attempts. We used a learning rate of 1e-6, no KL penalty, zero weight decay, and GPT-5 Chat as the simulated user and judge. We report results on checkpoint 50.
What changed
We evaluated checkpoint 50 on all 507 benchmark tasks, 20 attempts each, under the same protocol as every other model.
| MEASURE | BASE | AFTER RL | CHANGE |
|---|---|---|---|
| pass@1 | 51.70% | 60.78% | +9.08 pt |
| pass^20 (tasks) | 38 (7.50%) | 107 (21.10%) | +69 tasks |
| At least once | 453 (89.35%) | 446 (87.97%) | -7 tasks |
| $ per success | $0.177 | $0.139 | -21.4% |
| $ per all-20 task | $24.36 | $8.00 | -67.2% |
Table 3. Qwen3.8-27B before and after reinforcement learning on ThinkingBox rewards. 507 benchmark tasks x 20 attempts per model. No benchmark task was used in training. After-RL costs apply the base model’s listed rates to measured tokens, because no provider serves this checkpoint; they exclude the 24-GPU training run and the selection probes.
The model became more repeatable, not broader. It passed 69 more tasks on all 20 attempts and seven fewer tasks at least once.
Average accuracy rose, too. At 60.78%, the trained model scores above GPT-6 Astra and Kimi-K3 on pass@1 (Table 1), and the paper reports it as the highest of any evaluated model under 100B parameters.
Cost moved with repeatability. Each dependable task fell from $24.36 to $8.00, in the same range as GPT-5.4 ($6.80), GPT-6 Astra ($7.45), and Claude Opus 5.5 ($7.80). The price of a single success moved less. Figure 5 places the trained model on the same chart as Figure 3: it moved from $0.177 to $0.139 per success and from 51.70% to 60.78% pass@1—close to the frontier but still behind GPT-5.6 Sol on both axes. The larger change is per dependable task, because training nearly tripled the number of tasks passed every time. These comparisons price inference only. They say nothing about what the training run cost.
The hotel task in Figure 1 shows what the change looks like on one task. After training, the model left the booking and payments untouched in all 20 attempts. All expected records matched in 19 of 20; one attempt missed an expected tag. Leaving the booking alone is necessary for that task, but it’s not the same as passing it.
Smaller LoRA runs with the same reward also improved: Qwen3.6-27B rose from 32.94% to 53.17% pass@1, and Qwen3.5-9B from 5.65% to 13.33%, with more details in our paper.
Gaining repeatable success while losing a little coverage is consistent with sharpening: probability moves toward approaches that work repeatedly, and some rarely used paths disappear. Prior work has reported similar patterns.
Things to keep in mind
- Synthetic tasks. Benchmark and training tasks are synthetic reconstructions of enterprise workflows with simulated users. They aren’t production traffic.
- Held out, but related. No benchmark task was used in training. Training and benchmark tasks still share the ThinkingBox framework, simulated-user design, grading approach, and task style. We haven’t measured transfer to unrelated agent settings.
- Checks are only as complete as their specifications. A reward built from executable checks rewards exactly what those checks require—and nothing they leave out.
- Costs are estimates. They use list prices on a fixed date and exclude training, the simulator, the judge, infrastructure, and the downstream costs of failures.
The takeaway
If you build agents that change real records, four practices carry over directly:
- Check state, not transcripts. Write assertions against the records your agent leaves behind, as we detailed in our first post.
- Report repeated success. Run each task more than once, and report pass@1 together with the count of tasks passed on every attempt. Say which estimator you use.
- Probe before you train. Run your base model several times on your candidate tasks and look at the distribution. Tasks it always fails or always passes cost full rollouts and are unlikely to teach it much.
- Keep training and evaluation in sync. Replay the same recorded model output through the training and evaluation parsers and verify that both extract identical tool names and arguments. Otherwise, training may reward behavior that evaluation interprets differently.
Reference
- Framework: microsoft/thinkingbox, with the tb CLI, simulated-user loop, MCP Session Proxy, and evaluation harness
- Training: microsoft/thinkingbox-training, with data selection, rollouts, rewards, and the validated reference configuration
- Paper: arXiv:2608.19741
Our first post asked how to tell whether an agent had finished the job. The answer, a check on the records it leaves behind, turned out to be useful three times: to compare models, to price consistency, and to train for it.